8 Best Stock Trading Signals Providers in May 2026
Trading stocks can be quite a difficult endeavor, it requires countless hours of research and regular observation of the markets. Stock prices are quickly influenced by global news, geopolitical narratives and economic events, and it can be difficult to catch information in a timely manner to outperform the markets. Nowadays, the spread of information happens very quickly and stock markets usually react as fast as the information spreads across social media and broadcast news outlets. That is where stock trading signals are a handy way in assisting traders to make better informed decisions.
For traders wishing to avoid the time-consuming labor or analyzing the markets, stock market trading signals are a viable solution. Stock signal platforms supply traders with timely information of company stocks, providing valuable insights on the financial performance, growth trends and online presence metrics of global companies. These platforms either conduct human-led research or use algorithmic technology and artificial intelligence to analyze various data points to present easily digestible summaries on company stocks and their performances.
In this guide, we provide an in-depth review of the 8 best stock trading signals providers for May 2026. This review aims to cover the stock signals platforms, the various features, and also extra insights about stock trading signals and how they work.
-
-
A List of The Top 8 Stock Trading Signals Providers
Our analysts investigated a variety of stock signals platforms and based on this research we selected the 8 best stock trading signals platforms for 2026.
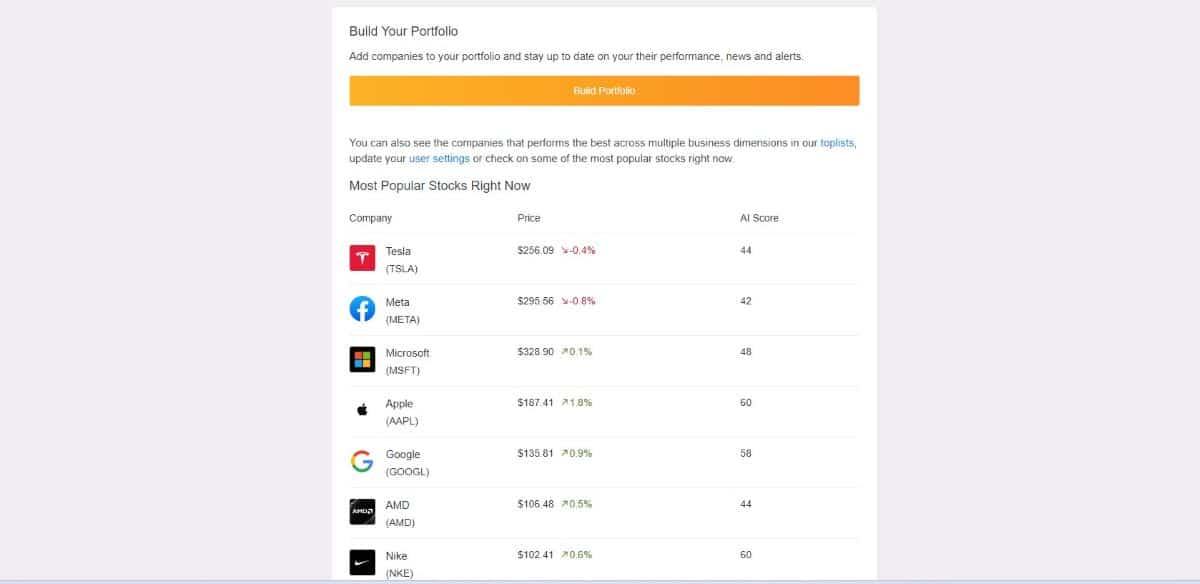
- AltIndex – AltIndex has a comprehensive approach to analysing company data and performance. The platform uses artificial intelligence to conduct analysis on companies using a variety of alternative data points. The platforms methodology included tracking of metrics such as website traffic, social media mentions, job postings, app downloads, financial performance, and online news coverage. Based on these social sentiment factors an AI score is derived which is categorised based on brand, employment, user growth and fundamental rankings. The platform boasts an 80% success rate with their AI stock picks and an average of 24% returns over a 6 month period.
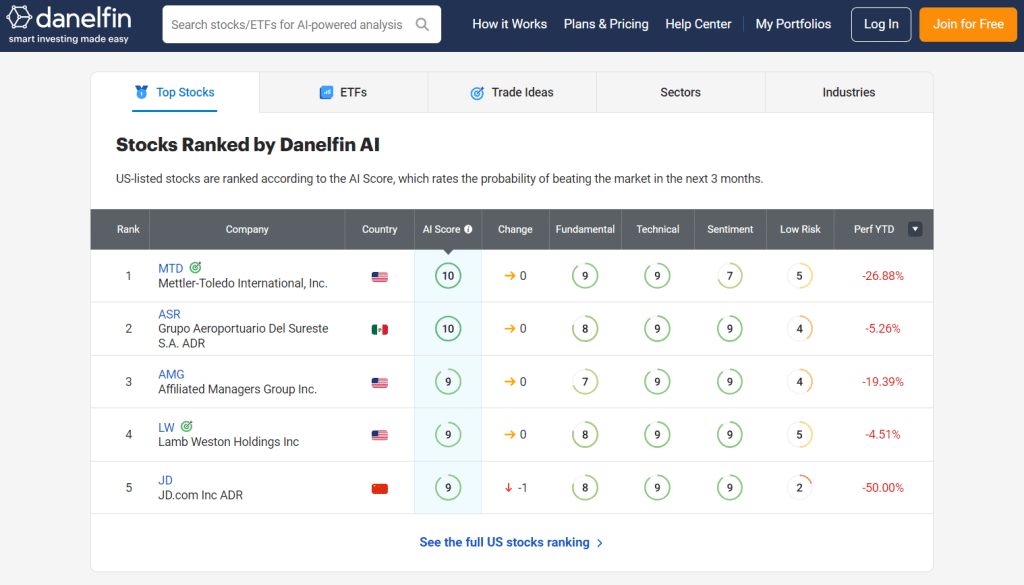
- Danelfin – Danelfin is a platform that describes itself as “smart investing made easy”. This stock market signals app is powered by artificial intelligence and ranks stocks with a score of 1-10 of beating the market in 3 months. Danelfin’s machine learning technology calculates stock AI scores using over 900 indicators for technical, fundamentals and social sentimental analytics.
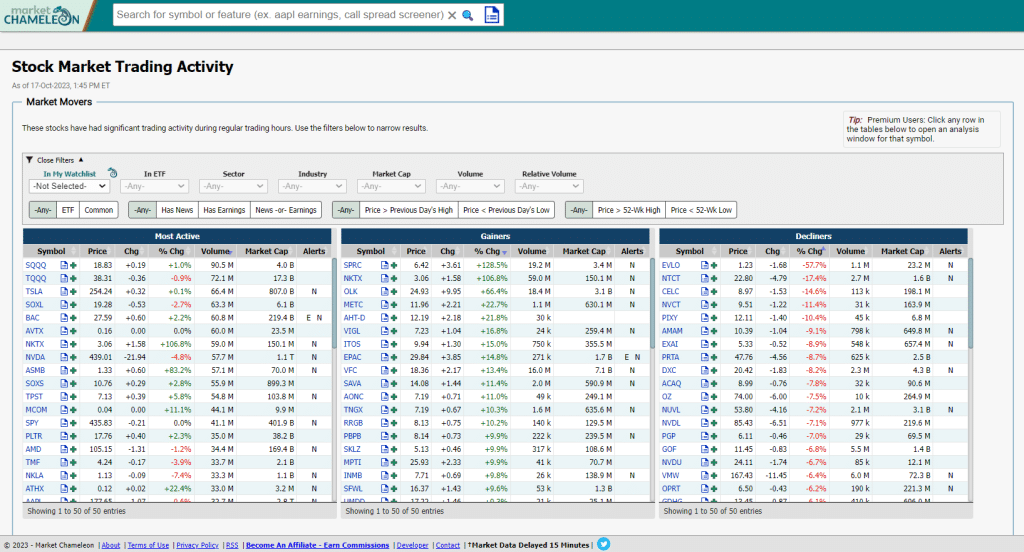
- Market Chameleon – Market Chameleon is a comprehensive research platform that provides trading signals for stocks and options. The platform uses various market research tools to provide users with trading ideas and alerts to help users make better informed investment decisions. Research on companies is conducted using three key time horizons, forward-looking, present and historical, and its signals are provided across various screening metrics such as large market movers, volume spikes, market report updates, calendar events and dividend releases, among others.
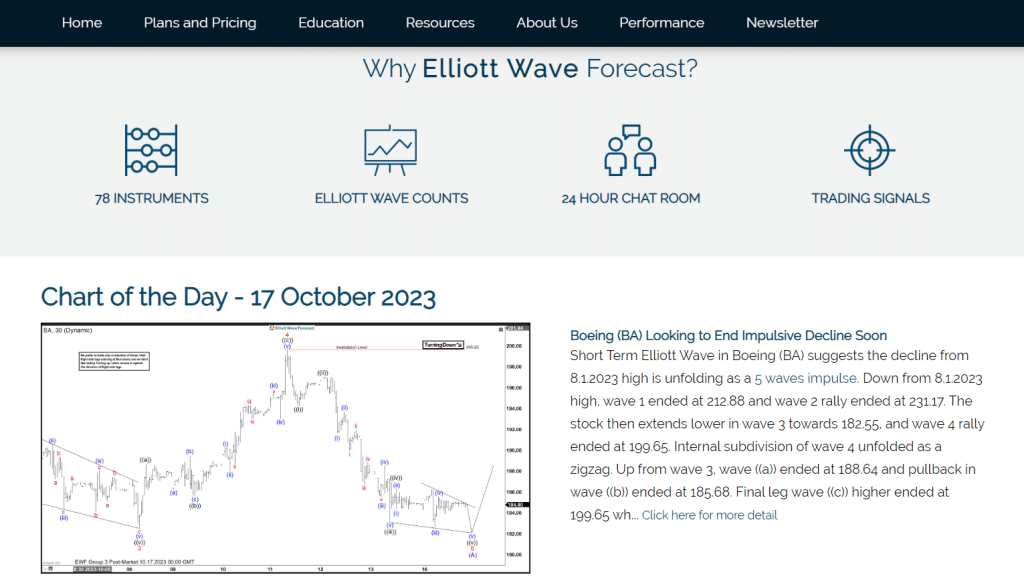
- Elliot Wave Forecast – Elliot Wave Forecast is one of the biggest technical analysis firms worldwide. The platform provides coverage of 78 market instruments in various asset classes including stocks, indices, forex, commodities, bonds and cryptocurrencies. This stock signals platform is operated by a small knit team consisting of 10+ market analysts, resulting in their forecasts and trade set-ups constructed by humans experienced in the financial sector. This stock signals app provides clients with access to a 24 hour chat room, daily technical videos and live analysis sessions.
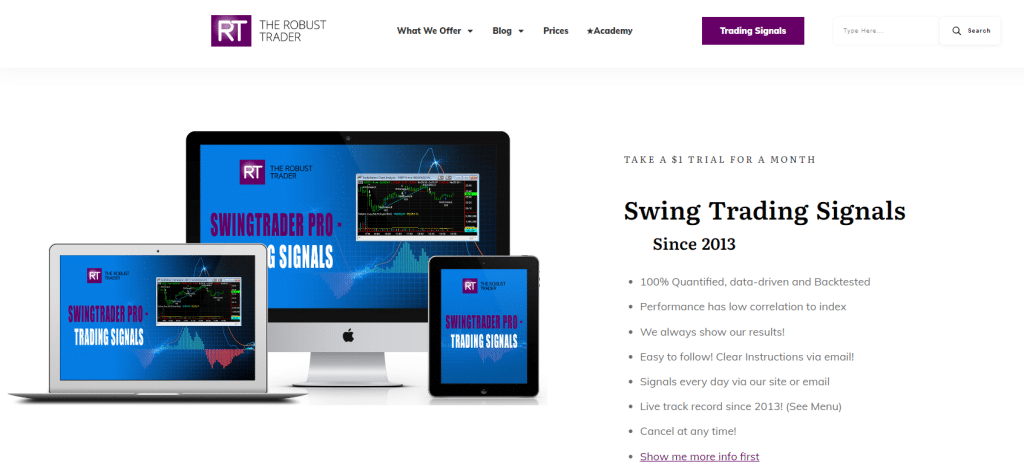
- The Robust Trader – This stock market signals platform was established in 2013. It specialises in swing trading strategies and targets the most liquid stocks in the US markets. The Robust Trader claims a win rate of 74% and their swing trading strategies are 100% quantified, data-driven and back tested. New customers are able to trial the stock market trading signals for 30 days for just $1. Membership to The Robust Trader costs $49 per month, or $24.95 monthly if choosing the yearly plan.
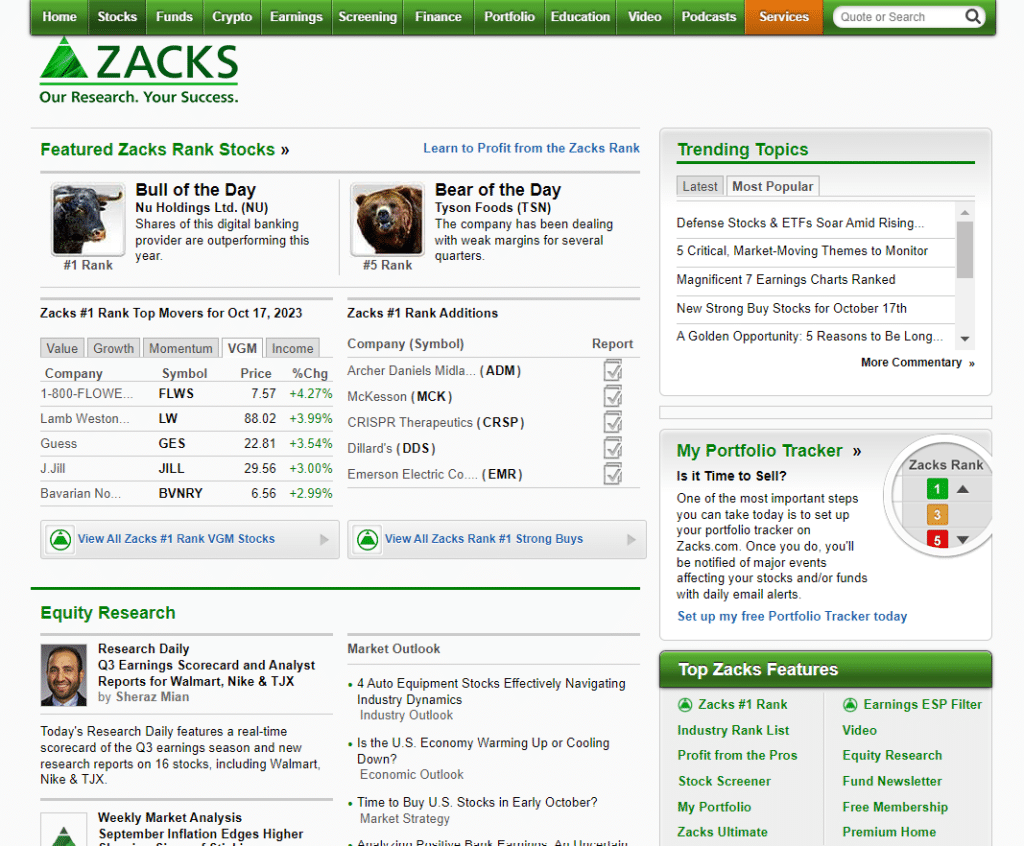
- Zacks Investment Research – Zacks in an independent financial market research platform that covers a range of stocks in the U.S. markets. The platform provides real-time market data and provides both short and long term stock picks. Zacks launched the Zacks Rank stock rating system which provides investors with stock picks. Historically, over the past 25 years Zacks has provided analysis that has more than doubled the performance of the S&P500 with average gains of 24.17% per year.
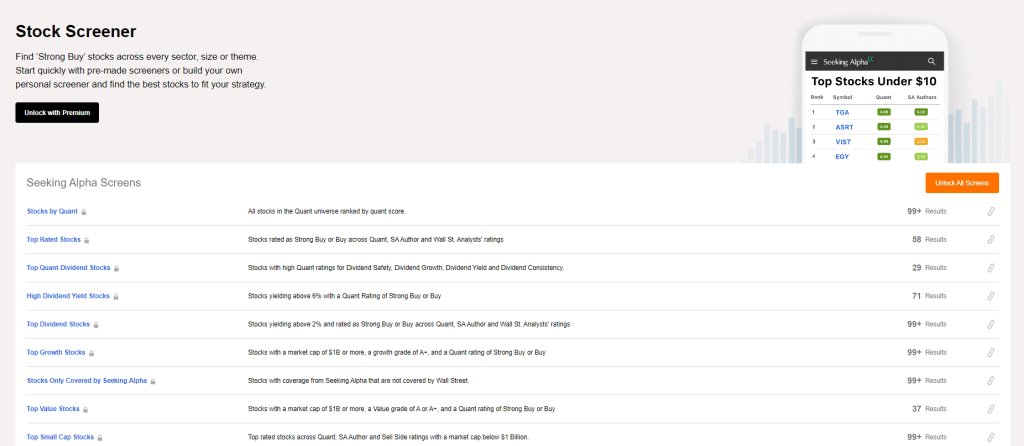
- Seeking Alpha – Seeking Alpha provides traders with “strong buy” stock signals across every industry sector. The platform creates data-driven quant buy signals for stocks using three research sources – Seeking Alpha quant model, independent contributors and Wall Street analysts. Their stock signal lists are evaluated using quantitative and fundamental analysis. The platform has a user-friendly mobile application for iOS and Android, and provides traders with top stock signals categorised across screeners such as industry sector, growth, dividends, small caps and short sells, among other factors.
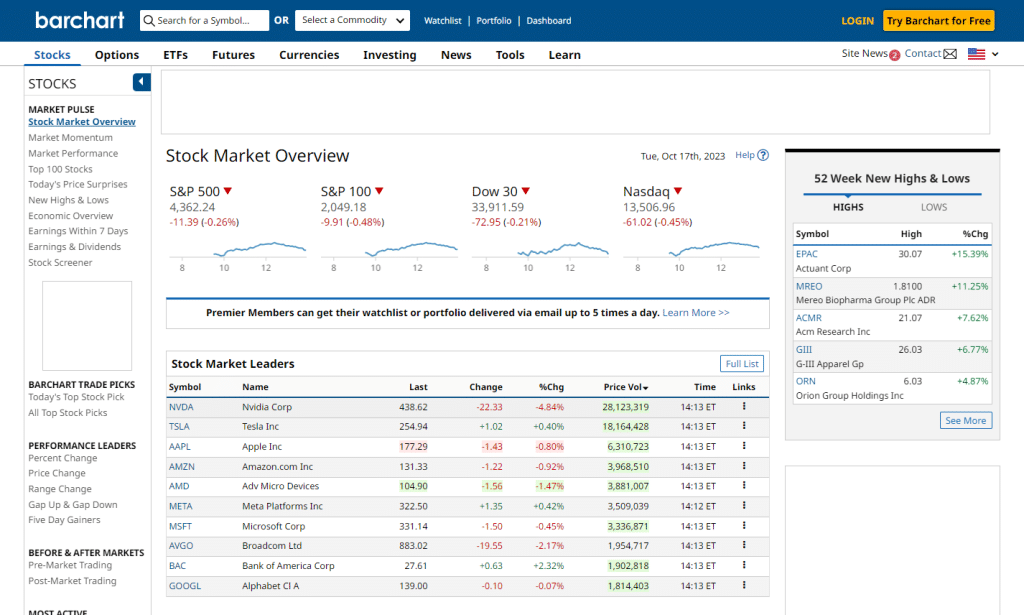
- Barchart – Barchart is an all-in-one institutional grade investment tool website that provides in-depth news, insights and analytics on all facets of investing covering stocks, options, ETFs, futures and currencies. The platform has dedicated stock analysis section providing a variety of information to traders including metrics, performance analysis, leader rankings, economic overviews and trading signals. Barchart provides buy, hold and sell signals, primarily using MACD oscillators, moving average indicators and their proprietary computerised trend analysis system, Trend Seeker.
There is no guarantee that you will make money with this provider. Proceed at your own risk..
What are Stock Trading Signals?
Stock trading signals represent triggers for action that either suggest buying (longing) the stock, or selling (shorting) the stock. Trading signals are generated from analytical methodology which can either be human or conducted by programmed algorithms. The triggers are based on a pre-determined set of parameters and derived from various types of criteria such as technical & fundamental analysis, sentimental indexing, financial earnings reports, trading volumes, external economic factors and market news. In order to formulize stock trading signals, factors which can affect the price of a stock must be critically analyzed. By using various chart patterns indicators signal providers can get an idea of the future direction and possible future movements of the asset.
Companies that use algorithms make the process easier and time-efficient and can analyze a large group of assets at one time with the help of computational power. With this method companies will provide the algorithm with a pre-set of criteria to look at, and when a stock creates certain movements or reacts to certain market conditions the algorithm will emit a buy or sell indication.
How do Stock Buy and Sell Signals Work?
Stock buy and sell signals are indicated by factors that influence a company’s performance. These are internal and external factors which include financial performances and macroeconomic circumstances which can affect a stock or a given industry. There are several criteria types that humans and algorithms will need to look at when analysing stocks for buy and sell trading signals.
Technical Chart Patterns: Technical analysis is a common form of analysing assets by looking at the chart movements over different time frames. Charting is a common practice by traders, and various indicators and tools are used in order to identify patterns to devise likely probable outcomes. Charting tools include indicators such as Fibonacci, Moving Averages, Relative Strength Index (RSI), Bollinger Bands and different types of oscillators. These charting analysis tools provide a view of the overall performance and movements of an asset and can identify various factors such as support and resistance levels, good entry & exit points, likely future movements, the strengths of a stock according to previous closing price, and the volume comparisons of buyers and sellers.
Trading Volumes: Volume is crucial in stock analysis, while low volume stocks will have higher slippage and can be illiquid meaning there isn’t much trading activity happening with that given asset. High volume stocks will show good public interest and means that there are a significant amount of trades being placed with that stock. Volume spikes can help to identify signals, where sudden spikes will indicate some kind of event or occurrence which can triggered an increase in trading activity. Volume spikes can also be analyzed by looking at both buyers and sellers activity. Buying spikes will mean there is some positive occurrence which has created positive buying sentiment for the asset, while volume spikes of sellers will indicate a sell off meaning negative market factors are affecting the asset.
Sentimental Analysis: Some of the stock trading signal providers covered above look deep into the social sentiment of stocks. Looking at factors such as social media mentions, latest news updates about a given company, increases in employees, volume spikes in app downloads and any factors that indicate that the company is quite popular among the public is a good indication that the stock price will increase. Stocks react to positive or negative events and when there is a positive sentiment among the world about a given company it is likely that this causes a positive price action.
Financial Performance: The health of a company can easily be seen from their earnings reports. When a company is performing good it is evident from an increase in revenues and higher profits. Financial reports show all relative data to company performances, and stock trading signals can be derived from looking at quarterly reports and any other financial performance insights such as, information provided at shareholder meetings, product sales figures and market cap coverage of a company.
Fundamental Analysis: Fundamental analysis measures the intrinsic value of a company and looks at various internal and external factors which represent the companies financial situation. Fundamental analysis will consider factors in the world which can affect company stock prices looking at the state of the economy, the strength of a given industry and the financial performance of the company. These include macroeconomic factors such as inflation, interest rates, market capitalization, earnings per share, profit ratios and debt/equity comparisons.
Our Reviews of the Best Stock Signals Providers
Let’s take a closer look at each stock trading signals provider to better understand which one is the most suitable. Our team of experts tried and tested several providers themselves and also used user testimonials to find the very best platforms that are available. While we always strive to present accurate information, all experiences are different. You should be prepared to lost funds before using a signals tool to trade.
1. AltIndex – The Best Stock Trading Signals Provider That Uses Alternative Data
Our experts rank AltIndex as the best stock market trading signals provider. AltIndex focuses on stocks in the U.S. markets and offers AI stock picks, stock alerts and various alternative insights to assist traders on due diligence research. The platform provides a seamless and easy to use interface and monitors company performances using a wide range of alternative data points. These include tracking of job postings, upticks in website traffic, app downloads, news mentions and social media sentiments. The platform also delves into quarterly financial performances while identifying insider transactions and large purchases of companies’ stocks. AltIndex leverages this data to highlight trends on companies and derives an AI score which indicates the potential of positive incoming price action.

AltIndex boasts a win rate of 80% on their AI stock picks and provides users with 100+ daily stock alerts and 100,000+ daily insights. These range from identifying upticks in website traffic, trending mentions across different social media platforms, growth in app downloads and increases in job postings. Their algorithmic technology tracks these various parameters in real-time, allowing traders to have timely information, statistical data and the latest insights into company sentiment.
AltIndex is free to use, however, this way will have limited access and features. Below, find details on the subscription features and what users can access across the various packages.
Free Access: Only be permitted to have 20 visits to the dashboard, tracking of 2 companies in the portfolio, 1 AI stock pick and 2 stock alerts, with limited viewership of the stock screener. Users will have access to the newsletter and email support.
Starter Subscription $29/month: Permitted to have unlimited visits to the dashboard, tracking of 10 companies in the portfolio, 10 AI stock pick and 10 stock alerts, with unlimited viewership of the stock screener. Users will have access to the newsletter and email support.
Pro Subscription $99/month: Permitted to have unlimited visits to the dashboard, tracking of 50 companies in the portfolio, 25 AI stock pick and 50 stock alerts, with unlimited viewership of the stock screener. Users will have access to the newsletter and email support. With the pro subscription users can have 50 requests per day to download data via API.
App Key Specifications Pricing AltIndex Data is focused on U.S. stock market. Incorporates an AI score based on alternative data insights looking at financial performance and social sentiment analysis. 80% win rate on AI stock picks. Free plan with limited features. Starter plan is $29/month and Pro plan is $99/month There is no guarantee that you will make money with this provider. Proceed at your own risk..
2. Danelfin – Stock Analytics Platform That Uses Artificial Intelligence and Machine Learning
Danelfin has built its investment strategy using the power of artificial intelligence. Its proprietary technology is defined as “explainable artificial intelligence” and analyzes 10,000+ features per day per stock. Theplatform’ss predictive capacity is derived from analysis of over 600 technical, 150 fundamental and 150 sentiment indicators of every stock which then provides an AI score. The indictors used range from MACD, RSI, earnings per share growth, hedge fund investments and insider transactions, among many other popular chart analytics tools. The AI score ranking is based on the probability of beating the market in the following 3 months. Danelfin focuses on analysis of U.S. stocks and the STOXX Europe 600 market.

This stock signals provider has an easy to view trade ideas section which lists stocks with the best win rate. Stock data presented includes the past win rate, long/short indication, how many days have given buy signals, average performance over 1, 3 and 6 month time frames and the risk score. Their alpha generation capabilities are quite impressive, stocks with the highest AI score rank outperformed the S&P500 by an average of 20.08% after a 3 month period. Between 2017 – 2022, Danelfin’s stock signals strategy generated returns of over 158% compared to that of the S&P500 which was just 70% in the same period.
Danelfin offers 3 plan types, with a free option available with limited features and stock signals.
Free Access: Top 10 stock daily newsletter, 10 stock reports per month, top 20 stocks in rankings, top 3 industry sectors to invest in, only 1 portfolio tracking 5 stocks and top 2 trade ideas.
Plus Plan $17/month: Top 10 stock daily newsletter, unlimited stock reports per month, unlimited stocks in rankings, unlimited top industry sectors to invest, 5 portfolios with tracking of up to 30 stocks and top 25 trade ideas and overall alpha signals.
Pro Plan $49/month: Top 10 stock daily newsletter, unlimited stock reports per month, unlimited stocks in rankings, unlimited rankings of industry sectors to invest, limitless portfolios and stock tracking, unlimited trade ideas, alpha signals providing categorical technical, fundamental and sentiment alpha signals and capability to export stock score and indicator data to CSV.
App Key Specifications Pricing Danelfin Data is focused on U.S. markets and STOXX Europe 600. Uses over 900 technical, fundamental and sentimental indicators to give AI scoring. Outperforms S&P500 by an average of 20.08% over 3 month periods. Free plan with limited features. Plus plan is $17/month and Pro plan is $49/month 3. Market Chameleon – Signals Platform That Uses Time Horizon Tools and Data for Stock Signaling
Market Chameleon stands out by providing an intuitive interface albeit its dated look. The platform provides in-depth analytics of stocks using tools and data of three main time horizons, forward looking, present and past. Market Chameleon offers traders a variety of options when choosing stock signals across different categorical features. These include pre-market & after hours trading, market movers, S&P 500 volume bursts, unusual stock volumes, morning report movers and a number of market action lists. This gives traders a wide range of data to choose from depending on what technical and fundamentals they wish to look at.

Market Chameleon also providers traders with timely stock market alerts, a news scanner which tracks leading financial news broadcasts, and trading ideas that provides trade card screeners looking at seasonality, bullish and bearish signalled stocks. The platform gives traders a huge amount of data across a variety of analytic methods that can help to have an edge over the stock market.
One key feature of Market Chameleon is that their free access provides quite a lot of features from categorised stock features, market action lists and dividend analytics. For premium subscribers Market Chameleon offers various data reports, stock screening tools, price action analysis tools and dividend summaries across different parameters.
App Key Specifications Pricing Market Chameleon Stock signals provided using time relative tools and data. Provides categorical quantitative data on technical and fundamental analytics of stocks. Free to register with limited features. Stock Trader plan is $39/month and Total Access plan is $99/month 4. Elliot Wave Forecast – One of the Largest Human Led Technical Analysis Firms
Elliot Wave Forecast primarily conducts technical analysis on stocks, forex, commodities, cryptocurrency, ETFs and world indices with a team of human market analysts. Their team consists of experienced professionals that cover 78 market instruments across the various asset classes mentioned. The platform provides comprehensive and timely forecasting of market assets while also supplying both retail and institutional clients with educational resources.
Elliot Wave Forecast covers various regions stock markets from NASDAQ, Dow Jones, FTSE Index, DAX Index, NIFTY 50, IBEX Index and the S&P500. The platform provides clients with access to a 24 hour chat room, live trading signals, quarterly & yearly forecasting, intra-day videos, daily technical video analytics and live chart analysis sessions.

The platform has atier-basedd subscription model starting at $99.99 per month. Their tiered plans are Silver at $99.99, Gold at $199.99, Platinum at $299.99 and Diamond costing $399.99. However, to obtain trading signals, users need to opt for the platinum plan which is quite costly at $299.99. In comparison to other stock trading signal apps this is quite an expensive option.
We can consider Elliot Wave Forecast as quite limited in the sense that the platform solely focuses on Elliot Wave indicator method, unlike other platform that use a wide range of charting analysis and indicators. This providesa limitedd view on the markets, and they do not use any other technical or fundamental analysis tools. This can limit the accuracy of trading signals and does not show a clear picture of the health, financial performance and social sentiment factors, which are also key to consider when finding viable stock trading signals.
App Key Specifications Pricing Elliot Wave Forecast Human analysis of 78 different market instruments. Provides users access to a group chat with 24 hour traders chat room, live trading sessions, daily technical analysis videos, trading signals and other educational resources. Tiered subscription model. For trading signals either platinum plan at $299.99/month or Diamon plan $399.99/month. 5. The Robust Trader – Daily Pre-Market Swing Trading Signals for Experienced Traders
The Robust Trader was established in 2013 and provides pre-market trading signals daily to its users. It’s signals correspond to swing trading and the platform focuses on the U.S. markets, trading the most liquid stocks to keep slippage to a minimal. The Robust Trader will publish a maximum of 5 signals at any given time and they solely provide long calls, meaning they do not signal for downturns unlike other trading signal apps. The stock market signals that the platform provides are all quantitative and they do not rely on any human judgement.

Regarding their performance, The Robust Trader claims a success rate of 74% with a profit factor of 2.2. The profit factor is a metric represented by the gross profit divided by the gross loss, with a profit factor over 2, representing a highly profitable system. Stock buy signals from The Robust Trader are sent to subscribers via email before the market opens. The price of subscription to The Robust Trader is $49 per month, however, users can benefit from having a one month free trial for just $1. Users are able to lower the subscription fee by 49% if opting in for being billed annually which will cost a total of $299.99 for a whole year. However, if choosing the annual plan then traders will not qualify for the $1 for one month trial.
App Key Specifications Pricing The Robust Trader Stock signals primarily focused on short-term swing trades. Maximum of 5 signals at a time and only provide buy signals, no short-selling signals. Only uses quant data with no human judgement. Success rate of 74%. One month free trial only $1. Monthly billing plan is $49/month. Save 49% with Annual billing plan at $299.99/year. 6. Zacks Investment Research – Quantitative Stock Rating System Focused on Earnings Estimates
Zacks is a quantitative research platform that focuses on company earnings reports and has developed a stock ranking system which provides investors with both short and long term stock signals. The platform has operated for over 25 years, providing comprehensive research and market outlooks on the stock market. Zacks provides stock investment ideas through research conducted by its in house analysts. The platform also has various rank boards which provide data on earnings trends, fundamentals, performance, chart analytics and a heat map. Zacks has a stock rank section that categorizes companies by sector and industry providing statistics on growth, return on equity and percentile changes in performance.

Regarding stock signals, the platform provides a scoring system for company stocks that are based on value, growth and momentum. It covers upside and downside, signalling both strong buys and strong sells, providing analytics on over 250 industry group types. Zacks also has an intuitive stock screener service where users are able to create custom screens using a variety of filters, allowing specific focus on influencing factors such as earnings, valuations, earnings per share, return on investment, dividends, price changes, income statements and various other company financial data types. Subscription to Zacks full suite is quite costly, with there being two types of subscription which provide stock signals. Zacks Premium is the cheaper option and provides full access to Zacks #1 Rank List, equity research reports and focus list portfolio of 50 long term stocks, with the price set at $249 per year. Zacks Ultimate plan costs $299 per month or $2995 per year. It provides full access to the Zacks Ranks, all short and long term trading portfolios, complete market insight access, Zacks top 10 stocks and also provides signals for stocks under $10, among all other features in the Zacks platform suite.
App Key Specifications Pricing Zacks Investment Research Short and long-term stock signals provided with research conducted by in-house analysts using time relative tools and data. Comprehensive stock ranking boards that cover over 250 industry sectors. Zacks Premium plan is $249/year. Zacks Ultimate plan is $299/month or $2995/year 7. SeekingAlpha – News, Alerts and Real-time Analysis on Stocks
Seeking Alpha assists investors to make better informed investment decisions through their human led research outlet. They provide in-depth stock analytics whereby the research is conducted by investors that act as their in-house analysts. They cover a diverse range of opinions that cover both bull and bear scenarios, not only looking at upsides of stocks. The platform utilizes fundamental analysis tools, crowdsourced debates and actionable market data from reliable news outlets to construct their stock signal data. Their stock screener categorically lists the top stocks to watch, enabling traders to find strong buy stocks across various sectors.

Seeking Alpha has a subscription service called Alpha Picks which is a stock recommendation tools. Their in-house expert team conducts quantitative data-driven research in order to suggest stocks that are likely to perform with positive price action. Alpha Picks sends its clients two new portfolio additions every month. Signals will include actionable suggestions such as buy and hold, sell alerts when there is a shift in ratings and up-to-date performance data. Their track record shows outperformance of the market by 20%. Subscribing to Seeking Alpha is $239 per year, with a 7 day free trial available and discounted first year at $199. For traders who only wish for the Alpha Picks and do not want access to all the other stock market data and screeners the standard annual subscription is $199, however, they offer a promo price of $99 for the first year.
App Key Specifications Pricing Seeking Alpha In-depth quantitative stock market data provided by team of in-house analysts. Covers both bullish and bearish signals. Historical outperformance of the market by 20%. 7 day free trial available. Alpha Picks plan is $199/year (1st year $99) and Full Access plan is $239/year (1st year $199) 8. Barchart – All-in-one Suite for Stock Market Insights & Signals
Barchart is a comprehensive platform that provides a variety of data on stocks. The platform primarily focuses on coverage of the U.S. markets which include the S&P500, S&P100, Dow 30 and Nasdaq. Barchart provides users with market pulse news which covers insights based on stock performance leaders, most active stocks by volume, highs & lows, 7 day earnings reviews, dividend analytics and stock liquidity levels. It also provides coverage by sector with focused heat maps, industry ranking and performance of categorized industries.

Regarding stock market signals, Barchart provides daily stock picks, however, states that these are simply suggestive trading ideas to be used as a starting point for further analysis. The platform seeks out promising stocks that signal a potential breakout by analysing past performances of trends compared to current market conditions. Barchart utilizes its proprietary algorithm to highlight stocks that are likely to outperform the market. They offer stock picks to subscribers either via the website or direct to email. The platform is free to register, however, this provides just the basic access with limited features. For full viewership of analytics there are two subscription packages, Plus which costs $99 per year, and Premier which costs $199.95 per year. However, Plus subscribers only have access to the dashboard, screeners and basic price alerts with a limit on downloadable data. In order to receive stock picks users must opt for the Premier subscription which provides limitless access to all the platforms features.
App Key Specifications Pricing Bar Chart Stock signals provided covering U.S. stock markets. Signals are based on analysing past performance of trends against current market conditions. Conducts quantitative analysis using its proprietary algorithm Free to register with limited features. Plus plan is $99/year (no stock picks). Premier plan is $199.95/year. How to Choose the Best Stock Trading Signals Provider
Choosing a stock market signal provider can be tedious. With so many platforms on the market, users should dive into the features and past results in order to find a suitable provider. It is crucial for traders to understand their needs, and what types of strategy they are undertaking when trading in order to find a provider that can cater accordingly. Success rate, fees, regional markets covered, trade time frame, and trading strategy are all facets to consider before selecting a suitable stock market signals platform.
✔️Success Rate
Many of the platforms covered show their historical results, displayed as a percentage. Some of the above platforms actually give access to a spreadsheet that show the trades that were signaled and the profit or loss breakdowns. The success rate will give a clear indication of whether the platform’s system is profitable and if their strategy is actually working for traders, with historical evidence.
✔️Subscription Fees
While there are some free signal providers available, most reputable stock market signal platforms will charge to use their service. After all they are a business and need to make some revenue in order to sustain their operations. Traders should consider their budget when selecting a provider and consider if the volume of their trading portfolio can produce enough profits to justify the subscription. Also, it is noteworthy to mention that cheaper isn’t always better, some providers may charge yearly subscriptions of multiple hundreds of dollars, however, they may be providing a vast range of analytics which can help to make better informed trading decisions.
✔️Regional Markets Covered
Traders will want to consider the regional stock markets that each individual platform provides signals for. For instance, if a trader is focused on the U.S. markets then it will not be of use to choose a provider that solely focuses on the U.K. stock markets. Checking what markets the platform focuses is on is most definitely a factor to consider in the decision making process.
✔️Trading Time Frame
Some of the platforms reviewed above indicate that their signals focus on the probability of beating the market in 3 months. While some focus on shorter term trades which are only valid for some hours or at most a few days. It is crucial for traders to evaluate what they are looking for, whether it’s smaller scalp trades or if they are looking to maintain a portfolio for some months and looking for longer term trades.
✔️Trading Strategy
Traders will want to consider what type of trading strategy they are focused on and if the stock signals platform is matching up. Similar to the trade time frames, some platforms are solely focused on swing trading or giving pre-market opening signals which can be for short term trades. While some platforms signals are for longer term trading strategy, and the predicted market movement may take longer to transpire.
There is no guarantee that you will make money with this provider. Proceed at your own risk..
Can You Really Make Money with Stock Trading Signals?
The short answer is yes, however, it is crucial to choose a reputable provider which has a solid track record and success rate in giving profitable signals. Stock signals are derived from various analysis methods, while some platforms provide signals that are a result of human research from professional financial analysts, others have programmed algorithms to follow pre-determined set of criteria.
It is always best to use the trial, whether it is free or for a small cost, to evaluate the performance of the service. Some platforms may give delayed signals which results in traders missing the optimal entry point. Another factor to take into account is that stock market signals providers’ success rate is calculated on the basis that a trader enters all the trades that are signalled. Not all trades will be profitable and users should check out the ratio of profit and loss trades of each provider. If a trader has tied up their liquidity in the first few trades, they may not be able to enter the other trades, and there is no guarantee that the trades entered will be profitable. Therefore, success rate gives an overall measure but should not be considered when thinking of each individual trade. This is where crucial risk management should be taken into account and it is best practice for traders to allocate liquidity accordingly.
However, with the correct liquidity allocation and risk management, stock trading signals can be a time-efficient way of potentially making profits with minimum research. By utilizing stock market signal apps, traders are able to save time on conducting hours of research, reducing the amount of work it takes to dive into financial reports and scanning online for news, events and social media sentiments. Although, even if trading is just a side-job for extra passive income, it is essential for users to keep track of the financial markets, checking in on trades and keep watchful eyes on their portfolio. The financial markets can react quickly to sudden news and events, and traders should be aware that there is no guarantee of profits. While the most reputable stock signals providers will be giving good indications on market movements, it is always best to keep a look over the trading strategies, check charts to ensure they are following the suggested outcomes and do not solely rely on computer algorithms to manage a financial portfolio.
Conclusion
To conclude, we have provided an overview of the 8 best stock trading signals platforms in 2026 and covered the core features of each platform. When evaluating the various stock signal providers, factors identified included the methodology of analysis, the costing, the success rate, regional markets covered and the user-friendliness of each platform. Our experts conclude that AltIndex is the platform that stands out from the rest.
AltIndex uses a range of analytic tools to provide its signals, and it’s AI scoring mechanism looks at various criteria to provide reliable market data. The platform uniquely looks at various technical, fundamental and social sentiment factors, and it is evident that AltIndex considers all internal and external facets that can influence a company’s stock. The platforms use of artificial intelligence and the clear identification of what it should look for tells us that it is a reliable alternative data provider. The platform has a very simplistic and user-friendly interface that caters to both novice and experienced traders.
Pricing is also another positive factor, where other platforms can be very costly for beginners, AltIndex has fairly priced subscription packages, with the starter being priced at $29 per month which is very affordable for any investor. The platform provides intuitive data which is easy to comprehend and insights are displayed in an orderly manner. This stock market signal provider makes the investing process easy without making it overly technical, and proves to be a winner when considering alternative data analytics on the stock markets.
There is no guarantee that you will make money with this provider. Proceed at your own risk..
FAQs
Do professional stock traders use signals?
Yes, professional traders also use stock signals to assist in trading. While professional traders may be conducting in-depth research on stock markets on a regular basis, stock market signals can assist them to have extra insights or categorical overviews based on specific criteria.
Are stock signals reliable?
This depends on the signals provider and their track record. All in all stock signals can be reliable if the platform is using correct risk management practices and its quant data is following the right set of criteria which is regularly checked and updated.
How do you get stock trading signals?
Traders can get stock trading signals by using platforms like the ones we have reviewed above, such as AltIndex. Users will need to subscribe to the service and will either be able to view stock signals on the website dashboard or receive alerts to their email address.
What is the best stock trading signals provider?
Our expert review concluded that AltIndex is the best stock trading signals provider. It uses a variety of technical, fundamental and sentimental analysis methods to derive AI score ranks for stocks, indicating either strong buy or strong sell signals.
References
www.quantifiedstrategies.com/profit-factor/
www.britannica.com/money/what-is-fundamental-analysis
www.flowbank.com/en/research/what-is-trading-risk-management

Dimal Nathwani Finance and Crypto Writer


Dimal Nathwani Finance and Crypto Writer
View all posts by Dimal NathwaniDimal is a digital asset enthusiast and has worked in several well-established cryptocurrency start-ups and blockchain payments companies including CoinBurp and Nuvei. He is future thinker and global financial visionary, exploring how payments and money transfer are evolving with web3.
Before starting his career in crypto, Dimal studied at Middlesex University and the International Business School, accredited by Oxford Brookes University where he obtained a BA HONS in Finance and Accounting. Due to his financial background, Dimal has great analytical skills which he uses to write in-depth content about emerging crypto projects.
Crypto promotions on this site do not comply with the UK Financial Promotions Regime and is not intended for UK consumers.
WARNING: The content on this site should not be considered investment advice and we are not authorised to provide investment advice. Nothing on this website is an endorsement or recommendation of a particular trading strategy or investment decision. The information on this website is general in nature, so you must consider the information in light of your objectives, financial situation and needs. Investing is speculative. When investing your capital is at risk. This site is not intended for use in jurisdictions in which the trading or investments described are prohibited and should only be used by such persons and in such ways as are legally permitted. Your investment may not qualify for investor protection in your country or state of residence, so please conduct your own due diligence or obtain advice where necessary. This website is free for you to use but we may receive a commission from the companies we feature on this site.
Trading is risky and you might lose part, or all your capital invested. Information provided is for informational and educational purposes only and does not represent any type of financial advice and/or investment recommendation.
By continuing to use this website you agree to our terms and conditions and privacy policy. Registered Company number: 103525© tradingplatforms.com All Rights Reserved 2024
 We use cookies to ensure that we give you the best experience on our website. If you continue to use this site we will assume that you are happy with it.Scroll Up